9. Research Step by Step
Caution
This section will work best if we have another chapter that lines up with lesson two on finding research and managing a database. That way we can demo all the skills in one fell swoop.
The purpose of this chapter is to model for you what research might look like. We’ll ask a research question so that you can see how one might apply the skills from “Reading Effectively” best. Feel free to critique the process as outlined as much as you’d like. The purpose is not to agree with every idea put forth here, but to give you a feel for how the process of reading, understanding, and critiquing works.
9.1. How do we get to our research question?
Usually our questions come from a critical question we ask of something we encounter. These can be from research, or just from our lives: in fact often the two intertwine!!
Let’s imagine that one is gathered with their family or friends for a holiday meal and that uncle says the phrase “workers should keep their money, not pay it in taxes.” A critical mind might be asking what comes next, what questions can we ask that might expand our understanding of this issue, or open up problems? The next question might be “do most workers access public resources funded by tax dollars?” or “if the tax structure were different, would this worker take home more or less money in real terms?”
It’s good to think of as many questions about a topic of potential research as possible, but what we really need is something that we can find examples of, data on. This isn’t necessarily quantitative data, although that can be rather nice to work with, but it should be a question that we can find examples of and existing literature about. This way we know we’ll find some starting places to research an area.
For this example, we’ll go with the question “Are there any examples of people with higher and lower tax burden, and what is the outcome?” This question is all about finding an instance that would give us some real traction and data on answering the question. We would get some cases to compare against one another, which is often a great way to determine the impact of something like tax burden.
9.2. Finding some early sources
A first series of web searches will take us to a bunch of articles in various online journals and magazines which give information about state tax burdens (and the good ones will not only give state income tax – there are other state-level taxes!), affordability, and quality of life.
Putting “states by tax burden” into a search engine, one result is a wikipedia page called State Tax Levels in the US. If I put “states by income” into a search engine, we can find a wikipedia page called List of U.S. states and territories by income. Wikipedia does a really good job of collating lots of information into an accessible format, but we should always take a second to look at where a source is pulling from. Both of the pages say they get their data from the American Census Beaureau, so we can reasonably trust that the information is accurate. The Census Beaureau is an agency devoted to these exact kinds of statistics and is unlikely to have too much of a reason to skew its data or reporting.
With “State Tax Levels in the US” we can get an idea of how taxes change for residents in different states, and we can use our list of states by income as a very crude approximation for how well people are doing financially in those states.
9.3. Traditional Library Research, Step by Step
Traditional Library Research can look different depending on the library and accessiblity, but, following these seven steps will help you be sucessful conducting your own regardless of which Library you find yourself in.
Topic identification: Clearly definig the research question or topic of intrest. Start large and narrow your scope, think about what other fields relate to or inform the field of your main question.
Literature review: Conducting a comprehensive review of existing literature on the chosen topic to gain an understanding of the current knowledge surrounding it. Once you’ve explored what is already known, information gaps may start to appear or an idea might spark your curiosity, run with it.
Source selection: Identifying appropriate sources and materials that are relevant to the research topic. This step will typically involve using library catalogs, databases, and other resources to locate books, articles, and other relevant documents. Most libraries have staff that are trained in helping you find good sources, don’t be afraid to ask for help!
Source Evaluation: Assessing the credibility, reliability, and quality of the selected sources to ensure they are suitable for the research project. Looking to see if the text has been peer-reviewed, meaning it has been evaluated and assessed by experts in the same field or discipline, is a great way to evaluate your source. Using peer-reviewed articles ensures the sources your using are accurate and valid.
Information retrieval: Accesing the selected sources, either physically or digitally, and extracting relevant information. This step is pretty straight forward. Many libraries have call numbers and maps to help you easily locate texts.
Note-taking and organization: Recording and organizing the collected information. Having a system for noting key information or ideas relevant to your research question will not only help you organize your thoughts, but will also make report writing much more easy.
Citation and referencing: Properly acknowledging the sources used through accurate citation and referencing practices to maintain academic integrity and avoid plagiarism. This is why organizing the information as you collect it is so important. Keeping track of ideas that are your own and those that are someone else’s is key to avoiding one of the worst crimes in academia, plagiarism.
As demonstrated, no research question is limited by it’s field. In any academic project you will need to research a variety of topics, and it is important that you get comfortable doing so with efficiency and precision.
9.4. Noticing Trends
A really good place to start our critique process is to take notice of immediate trends that stick out to us so we can look more into wether there’s a useful piece of knowledge behind a correlation. One thing that sticks out is that it seems like states with higher taxes have higher average incomes. We can eyeball this just by looking at the data, but its important to be critical of immediate judgements like that.
We notice that those exceptions include Alaska and North Dakota. Then a thought comes to the back of our head: “Do I remember something about Alaska giving every resident a check to share oil revenues?” At this point we realize that there is too much nuance. We suspend the “quick bit of research” with this provisional conclusion:
It appears that high state income tax might correlate with high income. This means that higher taxes do not necessarily mean that a worker has less money to spend on what they want. In fact it might go the other way. This would mean that the politician’s ten word statement “workers should keep their money, not pay it in taxes” is a pandering phrase aimed at people who do not think critically about those statements.
The Investopedia article “9 States With No Income Tax”<https://www.investopedia.com/articles/financial-theory/08/standard-of-living-quality-of-life.asp> seems to cover some ground on accounting for some of these outlier states. They first give quick figures: the state tax burden rank. Putting that article together with the others might give some interesting insights.
We are almost ready to stop the quick dive: this temporary result is an acceptable interim conclusion until we have time to do more research. But we don’t stop quite yet: we first want to make sure that we list in our mind what are the limitations of the research we just did. Critiquing your own thoughts is important to making sure that when you research, you aren’t producing platitudes of your own. A few lingering questions are: (a) that first impression of tax rates correlating with income: is it quantitatively true? (b) does income capture all of quality of life? (c) how about infrastructure? (d) are those numerical rankings good enough or would more be captured by a more complete essay on quality of life in those states?
The idea in the first bits of research is not to suddenly become a genius who knows all there is to know on the implications of tax burdens. Instead the point is to turn give something for you critical brain to play with. To get you to a position where you can ask questions and understand just how much you don’t know, and maybe get a sense of where you could start looking to fill in the gaps.
Knowing how to produce this kind of “quick research” to a superficial statement is maybe the most important of our goals: if you learn to get several articles, vet their sources, and reach a deeper conclusion, then you are on the way to being free of misinformation, and free from trusting dangerously shallow reporting.
9.5. Getting Quantitative
While this step is a bit over the top if you’re just doing a quick bit of research, I quickly pulled the data from the wikipedia pages and compared the 2015 dollars taxed per capita with the 2015 average earnings from each state and whipped up a scatter plot. The trend we noticed sort of holds, but the correlation isn’t crazy tight and there are some wild outliers.
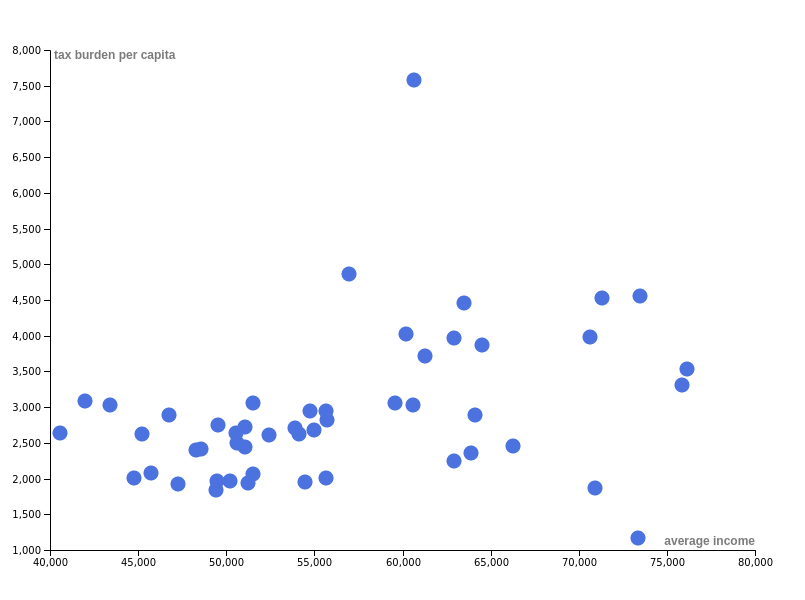
The plot suggests that the trend we noticed had a little something to it, but it was too simple. There’s a lot more going on than a simple relationship between taxes and earnings.
And remember that correlation is not the same as causation! Even if we established a nicer, simpler connection between taxes and income, we would still have to show the mechanism by which the two influence each other before we could even get close to saying that this correlation shows a causal relationship.